Research Question: How can we take advantage of the spatio-temporal connections between physical parameters of a geographic location and use them to predict wildfires using deep learning?
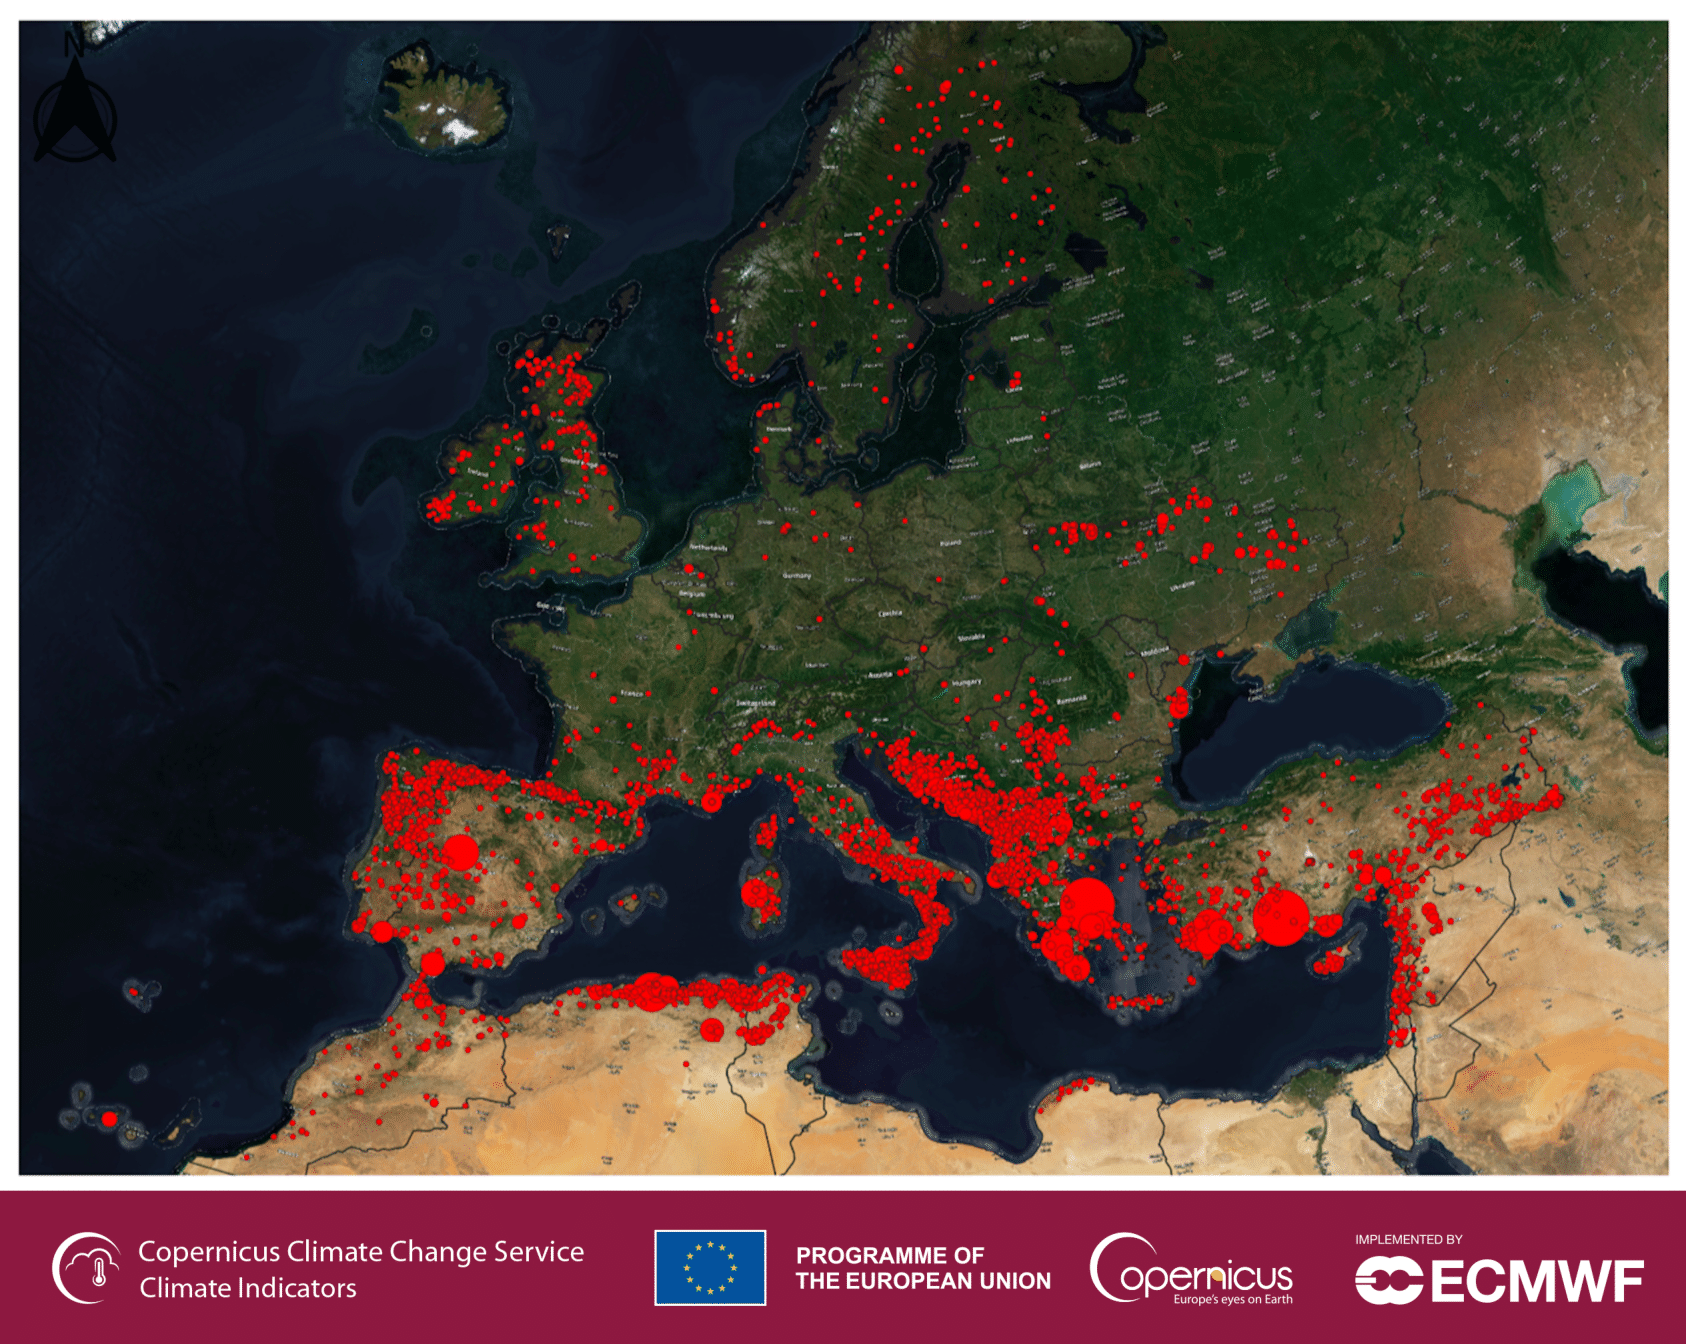
State-of-the-art
Current modelling approaches for predicting and explaining fire patterns are mainly based on classic statistical approaches or ML models like Random Forests. More sophisticated methods like Convolutional Neural Networks (CNNs) have been applied to other fire-related problems like short-term fire forecasting. The common baseline in all these implementations is that they rely only on local interactions between the different covariates, ignoring the potential long-scale dependencies that may exist between the different explanatory variables.
Beyond state-of-the-art
Although there have been some successful applications of DL for Earth System science, traditional DL architectures like plain CNNs that treat each image patch independently do not account for the large-scale interconnections of the Earth System. In SeasFire, we aim to expand the state-of-the-art, demonstrating the use of the latest progress in the DL paradigm that can capture complex dataset interactions, namely Graph Neural Networks (GNNs).
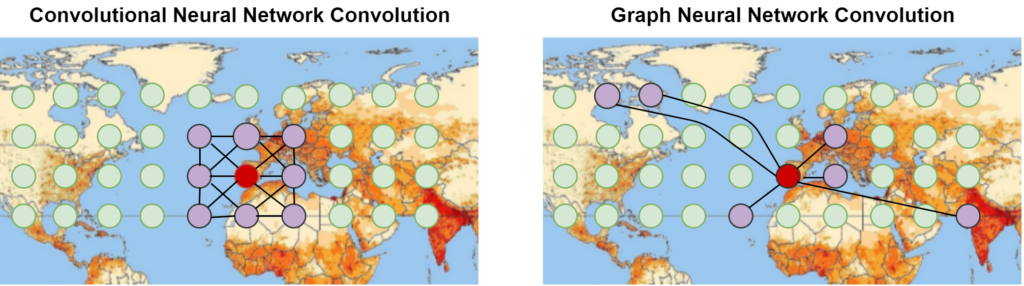
GNNs have emerged as a DL architecture that can effectively model data that is structured as graphs and has been successfully applied to Earth System related problems [4]. Contrary to commonly applied methods that treat each satellite image patch as independent from others, we see promise in GNNs as a way to model and quantify the strength of inter-patch associations and identify teleconnections in the Earth System. Another promise that we see is that they have been successfully used to embed physics knowledge when defining the edges of the graph. Specifically, in some cases they allow the model to learn the edge structure of the graph and identify teleconnections in a data-driven way [4].
How do we represent the Earth as a graph?
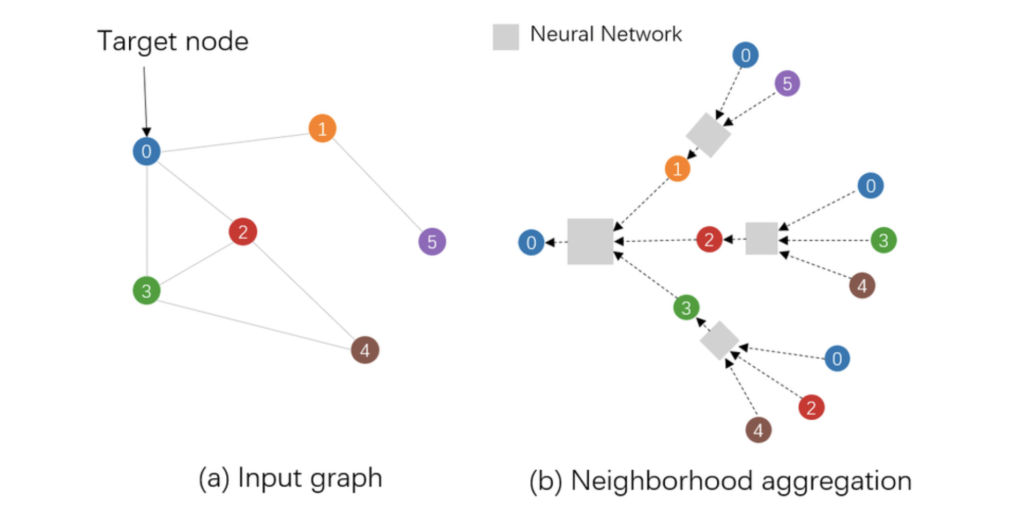
Our proposed architecture will use graphs both on a global and a local scale. The nodes are geolocations at a specified spatial resolution and can be connected in space and time. In SeasFire we will focus on how to connect them in space. When we build a graph, we assume the node features are available and aggregated for the daily scale. So for each day, we have a new graphical representation of the Earth [4].
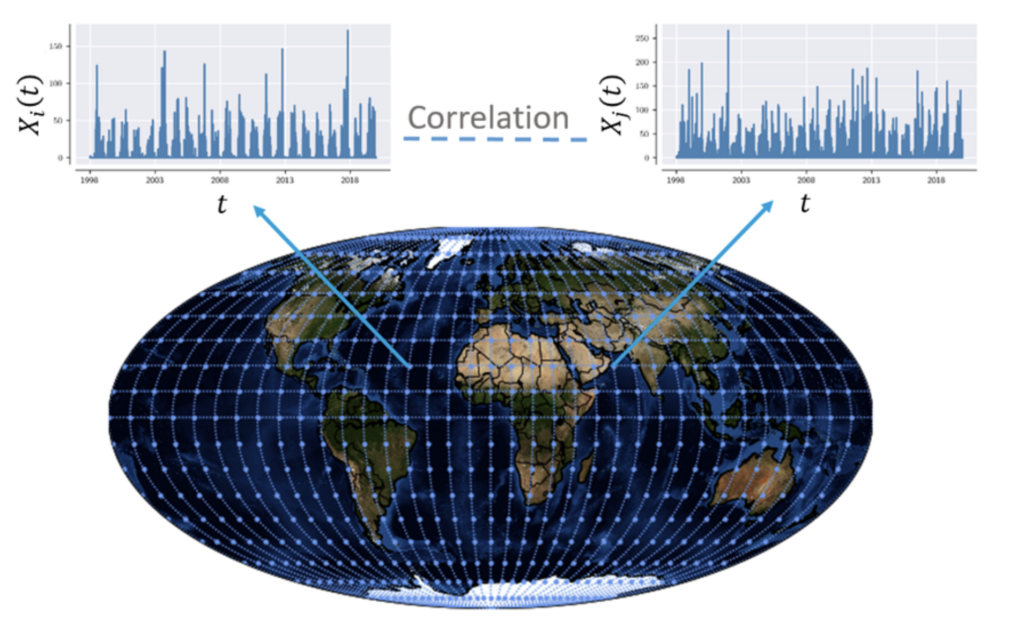
Long-range dependencies between grid cells of a climate dataset will be learned by encoding the connectivity between different geolocated areas using a continuous adjacency matrix. Our approach will utilize the distance and possible already known physical interactions between grid cells, in order to bootstrap the learning process.
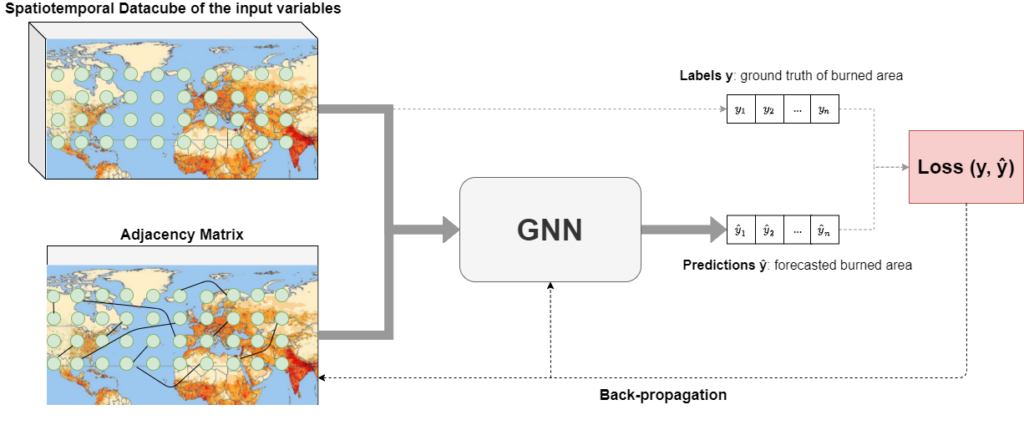
The graph nodes will also be associated, for each time step, with a feature vector of climate variables. Given the learned adjacency matrix, additional Graph Attention Networks (GATs), both with spatial attention and temporal attention, will be utilized in order to forecast the seasonal fire patterns. Our dataset will consist of input time-series X (satellite data, weather data, etc) and targets Y (burned areas, emissions from fires) and our goal will be to train the GNN to learn the relation between X and Y.
The SeasFire ML pipeline
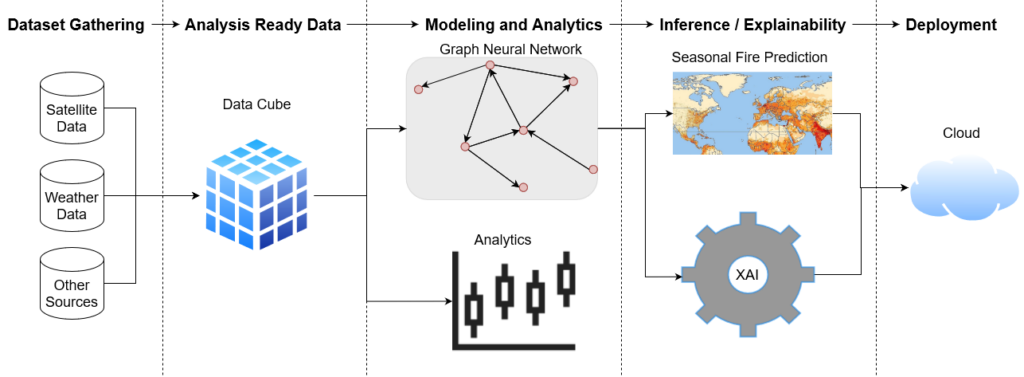
Our modeling approach that leverages GNNs will allow us to produce a single seasonal fire danger index that will be learned in a data-driven way from historical fire data. The graph aims to take into account teleconnections and lag effects from large-scale Earth System processes that are not explicitly considered by current models. This could allow us to predict, for example, that after a year of drought, more fires are expected in the next fire season or that certain anomalies in the sea surface temperature in the Atlantic will have some effect on the expected fire patterns and hint into unknown physical processes affecting fire seasons.
References
[1] Copernicus, “Wildfires | Copernicus,” climate.copernicus.eu, 2022. https://climate.copernicus.eu/esotc/2021/wildfires
[2] Z. Jin, Y. Wang, Q. Wang, Y. Ming, T. Ma, and H. Qu, “GNNLens: A Visual Analytics Approach for Prediction Error Diagnosis of Graph Neural Networks,” IEEE Transactions on Visualization and Computer Graphics, pp. 1–1, 2022, doi: 10.1109/tvcg.2022.3148107.
[3] “The network behind weather and climate,” CAFE, Dec. 22, 2020. http://www.cafes2se-itn.eu/communications/cafe-blog/the-network-behind-weather-and-climate
[4] S. R. Cachay et al., “The World as a Graph: Improving El Ni\~no Forecasts with Graph Neural Networks,” arXiv:2104.05089 [physics, stat], May 2021, [Online]. Available: https://arxiv.org/abs/2104.05089